Database Design: From Entity Relationship Diagrams to Physical Diagrams
In preparation for my upcoming test in SQL and relational databases for Launch School, I have designed a simple school relational database. I will be outlining the various diagrams and methods I used to create this relational database.
The first step in the creation of the relational database is a b straction. The school has teachers that each teach one subject and each subject can only be taught by one teacher. Each teacher can have many students and each student can have many teachers. Each student can only receive one grade from a class subject, but grades can belong to more than one student. If I extract all of the nouns from this paragraph I have: teachers, subjects, students, and grades. These nouns can be represented by rows of data called entities. These entities also share relationships with one another.
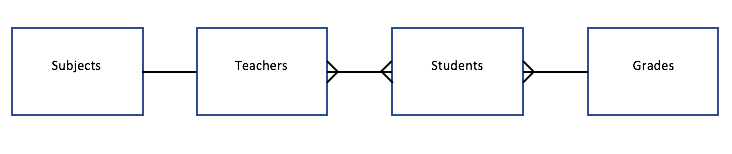
Entity relationship (ER) diagrams can be drawn to show entities and their relationships with one another. These entities can be represented as squares as shown below.

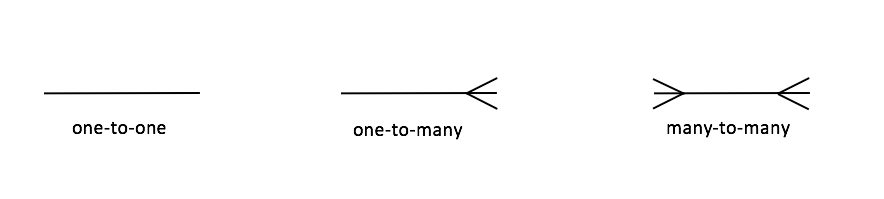
I also need to draw linkages from one entity to another to represent the relationship between the two entities. There are three different types of relationships entities can share: one-to-one, one-to-many, and many-to-many. These relationships can be represented using crows foot notation. The crows foot notation for each relationship is shown below.
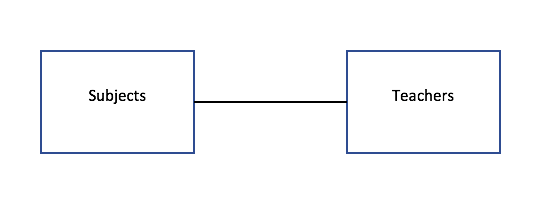
Since a teacher can only teach one subject and one subject can only be taught by one teacher, subjects and teachers share a one-to-one relationship.
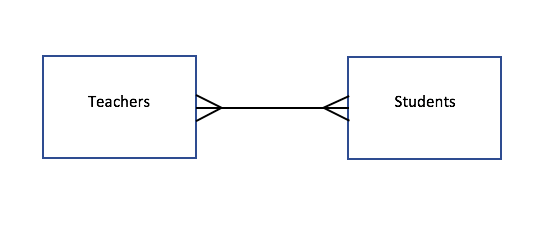
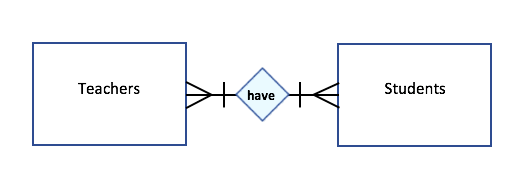
Since each teacher can have many students and each student can have many teachers, teachers and students share a many-to-many relationship.
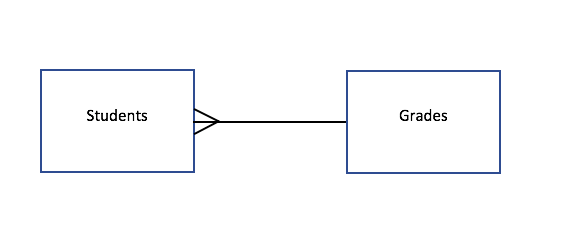
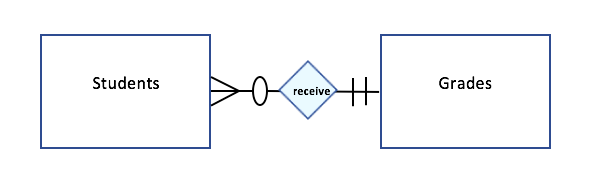
Since each student can only receive one grade per subject, whereas grades can be given to many students, students and grades share a one-to-many relationship.
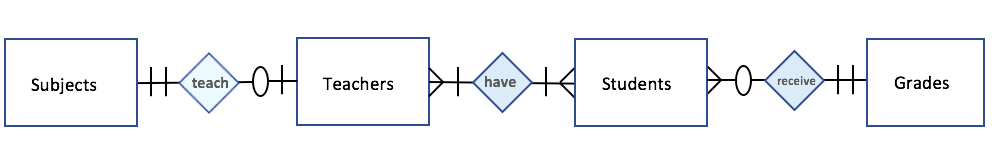
My final ER diagram is shown below.
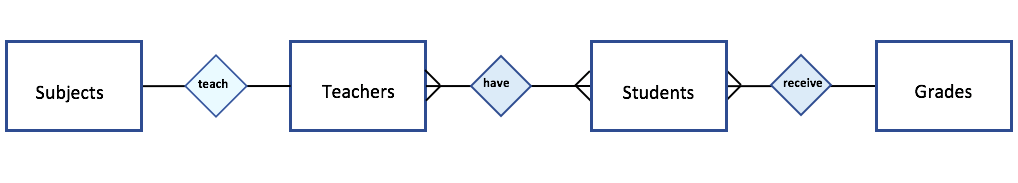
It is also helpful to describe the relationship between the two entities. The description of how the entities interact with one another will be illustrated by a diamond shape. The description of each entity relationship for the diagram is as follows. Teachers teach subjects and have students; students have teachers and receive grades. The updated diagram to reflect these modifications is shown below.
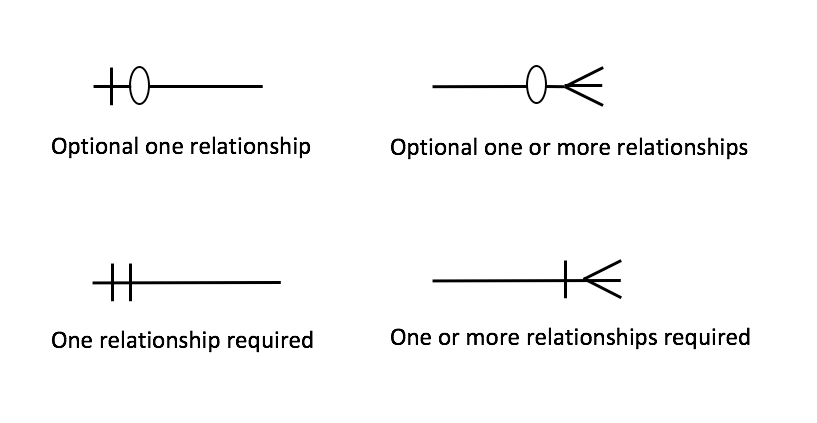
Another topic I want to address is modality. Modality indicates if the relationship is required or optional. If one entity needs to have a relationship with another entity, then there will be a vertical line through the link next to the entity. If one entity does not need to have a relationship with another entity then a 0 will be put through the line next to the entity. A diagram illustrating modality is shown below.
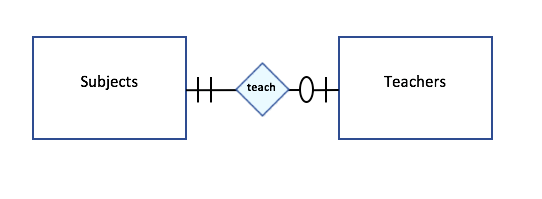
The subjects entity does not need to have a relationship with the teachers entity or it can have at max one relationship with the teachers entity. The teachers entity needs to have one and only one relationship with the subjects entity.
The teachers entity needs to have at least one or many relationships with the students entity and the students entity needs to have at least one to many relationships with the teachers entity.
The students entity needs to have one and only one relationship with the grades entity. The grades entity does not needs to have a relationship with the students entity or it can have many relationships with the students entity.
I have updated the ER diagram to show not only the relationships of one entity to another, but also the modality.
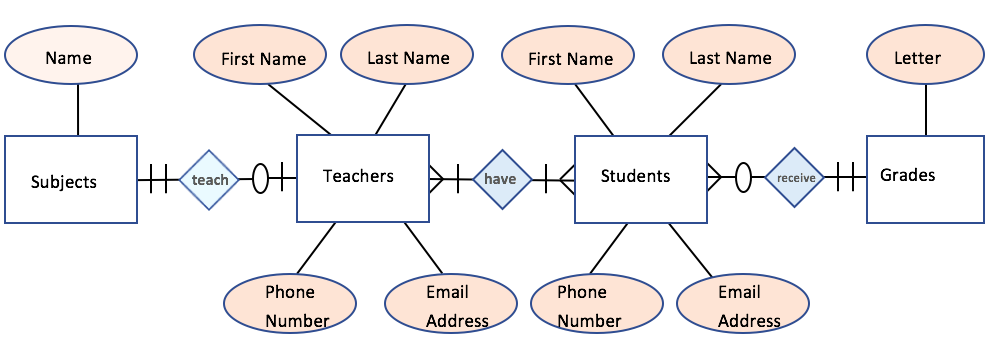
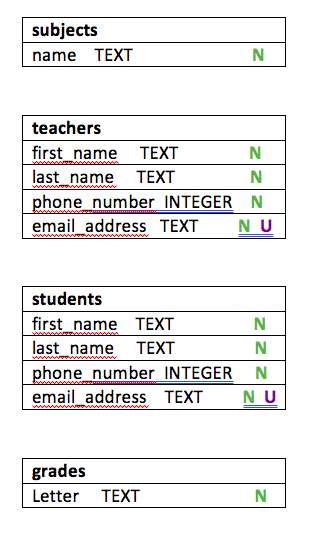
Each entity has attributes that are characteristics of the noun being represented. Each subject has a name. Each student and teacher can have a first name, last name, phone number, and email address. Each grade can be of a certain letter. The ER diagram has been updated with oval shapes to illustrate the attributes of the entities. The ER diagram below now displays these attributes.
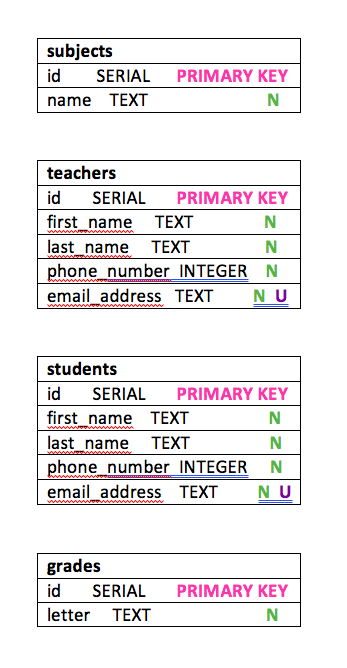
I can use a physical diagram to map out the schema I want for the database. The physical diagram will include table names, column names, column data types, column constraints and table constraints. The table names will be modeled after the entity names and the column names will be modeled after the attributes of the entities. The diagram below shows the physical diagram for the relational database which I will discuss in detail in the following paragraphs.
The physical diagram should list what values can be added to the columns via the data type and optional constraints. The data type indicates what types of data are allowed for a column. The data type for every column in each table (except for the phone_number columns) is designated as TEXT which only allows input of strings that can be of an unlimited amount of characters. The data type for the phone_number column is designated as INTEGER which only allows input of integer numbers.
Column constraints prevent certain data from being entered into the column. Each column in each table has a N for NOT NULL which is a column constraint that ensures that a value must be specified for the column and cannot be empty. Table constraints prevent certain data from being entered into table. The U for UNIQUE is a table constraint that was added to the teachers and students tables so that there can be no duplicate data entered for the email address columns for those tables.
It is important to be able to uniquely identify each row in a table so that it is easier to reference the row if changes need to be made or values need to be searched. The unique identifier that makes each row in a table unique is referred to as a key. A key can be thought of as a column of data where each row of data within the column is an unique value. For example, in the teachers table we could consider the phone_number column to be a key because each person should have a different phone number. Some problems with doing that is that a person's phone number can change, or a person could possibly not have a phone number.
The phone_number column is an example of a natural key because it is an existing value in the table that could be used to uniquely identify each row. Since natural keys are not very reliable, a special column needs to be created that will act as an official key which is referred to as a surrogate key. An id column can be added to each of the tables schema which acts as an unique identifier for each row of data in the tables. Since the id column is going to be the official key for the table, constraints need to be added to ensure that there are no null values that can be added to the column and that each value must be unique. For the id column I am going to give it a data type of serial which is used for id columns because it sets the data type to INTEGER, sets a NOT NULL constraint and also a DEFAULT constraint which will automatically add the next integer in the sequence. I also want to add the UNIQUE constraint to the id columns as well.

There is a primary key table constraint that can be added to the id column. This PRIMARY KEY CONSTRAINT is the equivalent of adding a NOT NULL and UNIQUE CONSTRAINT. The id columns are now referred to as a primary key for the table because primary keys uniquely identify a row of data for a table.
I now need to implement the relationships that were illustrated in the entity relationship diagrams. A foreign key references a row in another table. I can add a foreign key (FK) constraint to a column and specify what column in another table I want it to reference. It is best practice to have the foreign key reference the primary key of another table because the primary key uniquely identifies a row of a table. The foreign key (FK) constraint prohibits us from adding any values in the foreign key column if there is no corresponding primary key value located in the table the foreign key references.
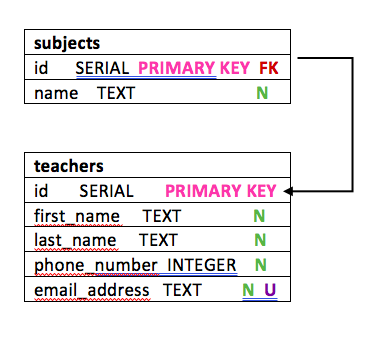
The diagram above demonstrates a one-to-one relationship. The subjects table has a column that acts as a primary key and a foreign key that references the primary key column of the teachers table.
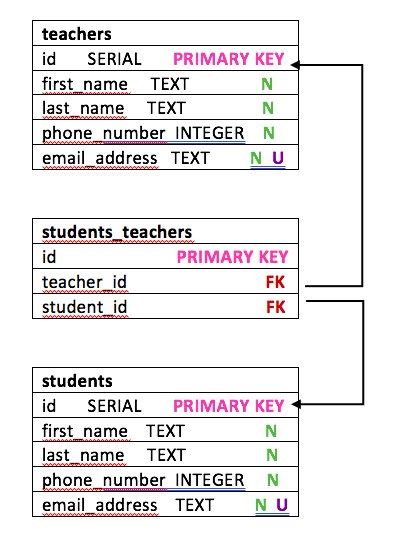
The diagram above demonstrates a many-to-many relationship. When there is a many-to-many relationship, there needs to be an extra table which is not accounted for in the entity relationship diagram. The extra table contains the foreign keys that each reference a primary key of another table. The students_teachers table has its own id column that has a primary key constraint and has a teacher_id foreign key that references the id primary key column of the teachers table. The students_teachers table also has a student_id foreign key column that references the id primary key column of the students table.
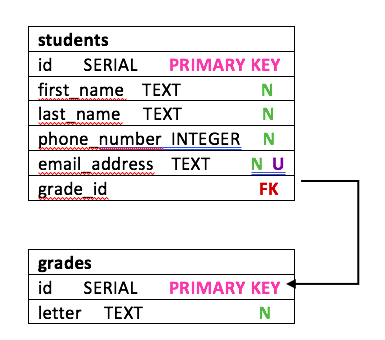
The diagram above demonstrates a one-to-many relationship. The students table has a foreign key column that references the primary key column id of the grades tables.
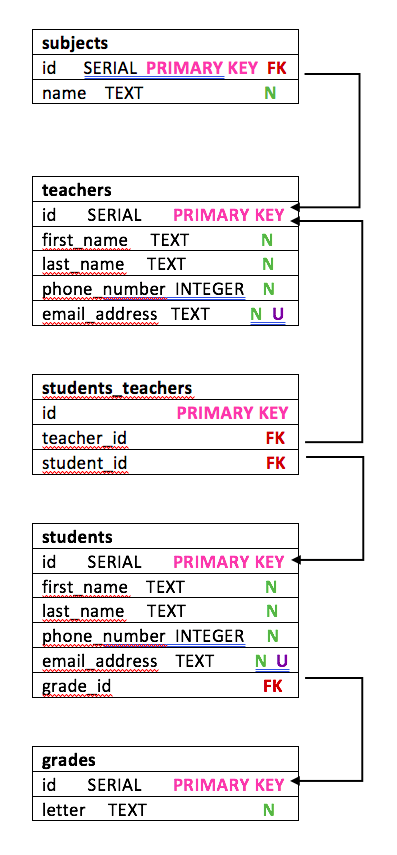
The above diagram shows the final physical diagram. Creating tables that each represent a specific dataset and connecting each through the use of primary and foreign keys, is called normalization. Normalization reduces duplication of data and maintains the data's integrity. Now that a physical diagram is created and the schema of the relational database is mapped out, the relational database can be implemented.
Source: https://medium.com/@ashleylynnrapone/database-design-from-entity-relationship-diagrams-to-physical-diagrams-16da210d01e9
Posted by: cornellgodlewskie0193165.blogspot.com


0 Comments